

If a “progress chart” is created to visualize the progress of work, the progress of each member will not be assigned to a specific person, and the project will proceed smoothly. Many companies use Google Sheets as a method of creating progress charts.
However, many people may be worried that they do not know how to create a proper progress chart in Google Sheets.
In this issue, we will focus on how to create a progress management chart with Google Sheets and some points to keep in mind for below people.
- “I want to create a progress chart in Google Sheets, but I do not know the correct method.”
- “I want to know what I should pay attention to when I manage progress with Google Sheets.”
- “I want to make my project successful by managing the progress without omissions.”
If so, this article will help you understand how to create a progress chart using Google Sheets and make your team’s work go smoothly.
Contents
- 1 Why is progress management necessary?
- 2 How to create a progress chart using Google Sheets
- 3 3 effective ways to use an Google Sheets progress chart
- 4 Best tool for making and managing progress chart Easier than Google Sheets
- 5 3 demerits of progress management with Google Sheets
- 6 Summary of How to create a progress chart in Google Sheets
Why is progress management necessary?
Here are 3 reasons why you need progress management. To achieve the following benefits, if you have issues with progress management, improve it as soon as possible.
(1) Team progress becomes visible
The first reason why progress management is necessary is to make the progress of team visible.
Sharing progress with all members of the team will prevent duplication of tasks. Furthermore, by keeping track of the number of man-hours and schedule of work, it is also possible to see whether each individual task is progressing smoothly.
Even if task of one person is delayed, the progress chart will help you visualize the task and assign the task to the employee who can spare the time.
(2) Preventing omission of tasks
Next, progress management also has the role of preventing the omission of tasks.
By creating a progress chart, you can see at a glance which tasks are due, so there is no need to worry about “I forgot I had a task”.
However, if you do not identify tasks before creating a progress chart, the risk of omissions increases.
(3) Quick response to problems
Finally, progress management will enable you to deal with problems promptly.
If progress is shared, even if a member is behind on a task, it can be noticed immediately. This allows for speedy response, such as adjusting schedules and reallocating tasks.
In this way, the risk of missed deadlines is greatly reduced if problems can be quickly followed up on when they occur.
How to create a progress chart using Google Sheets
To create a progress chart in Google Sheet, follow these steps
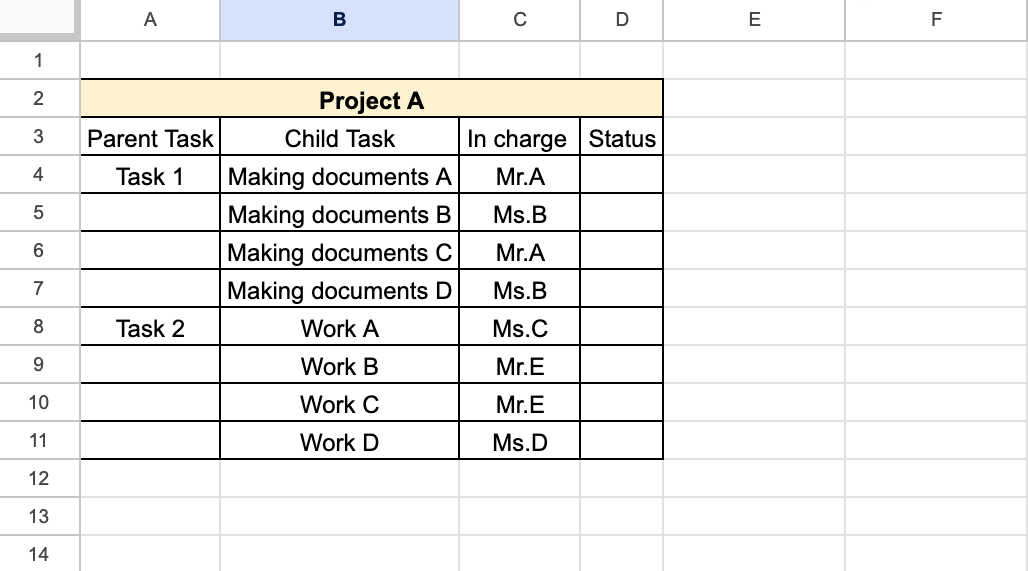
1. Describe the parent and child tasks, the person in charge, and the progress status
First, list the parent and child tasks, the person in charge, and the progress status. If the person in charge of each task is clear, it will make it easier to contact them immediately in case of any problems and to collaborate with them in daily work.
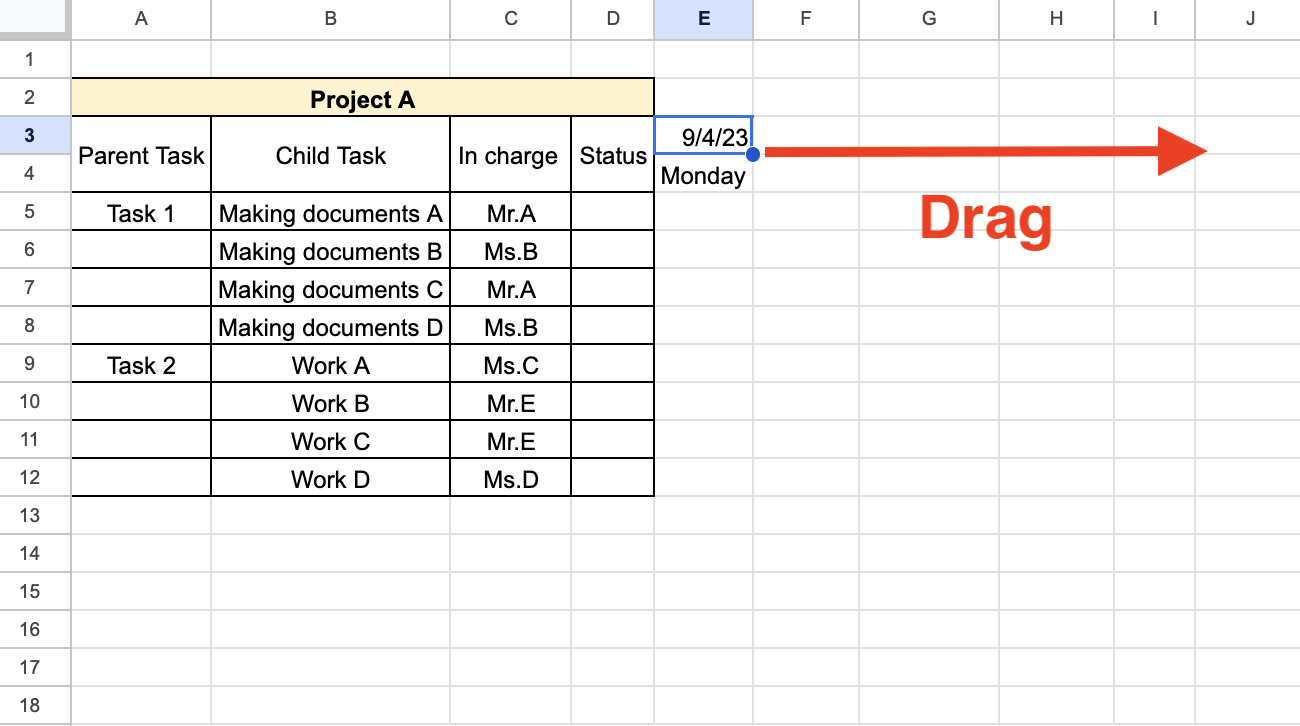
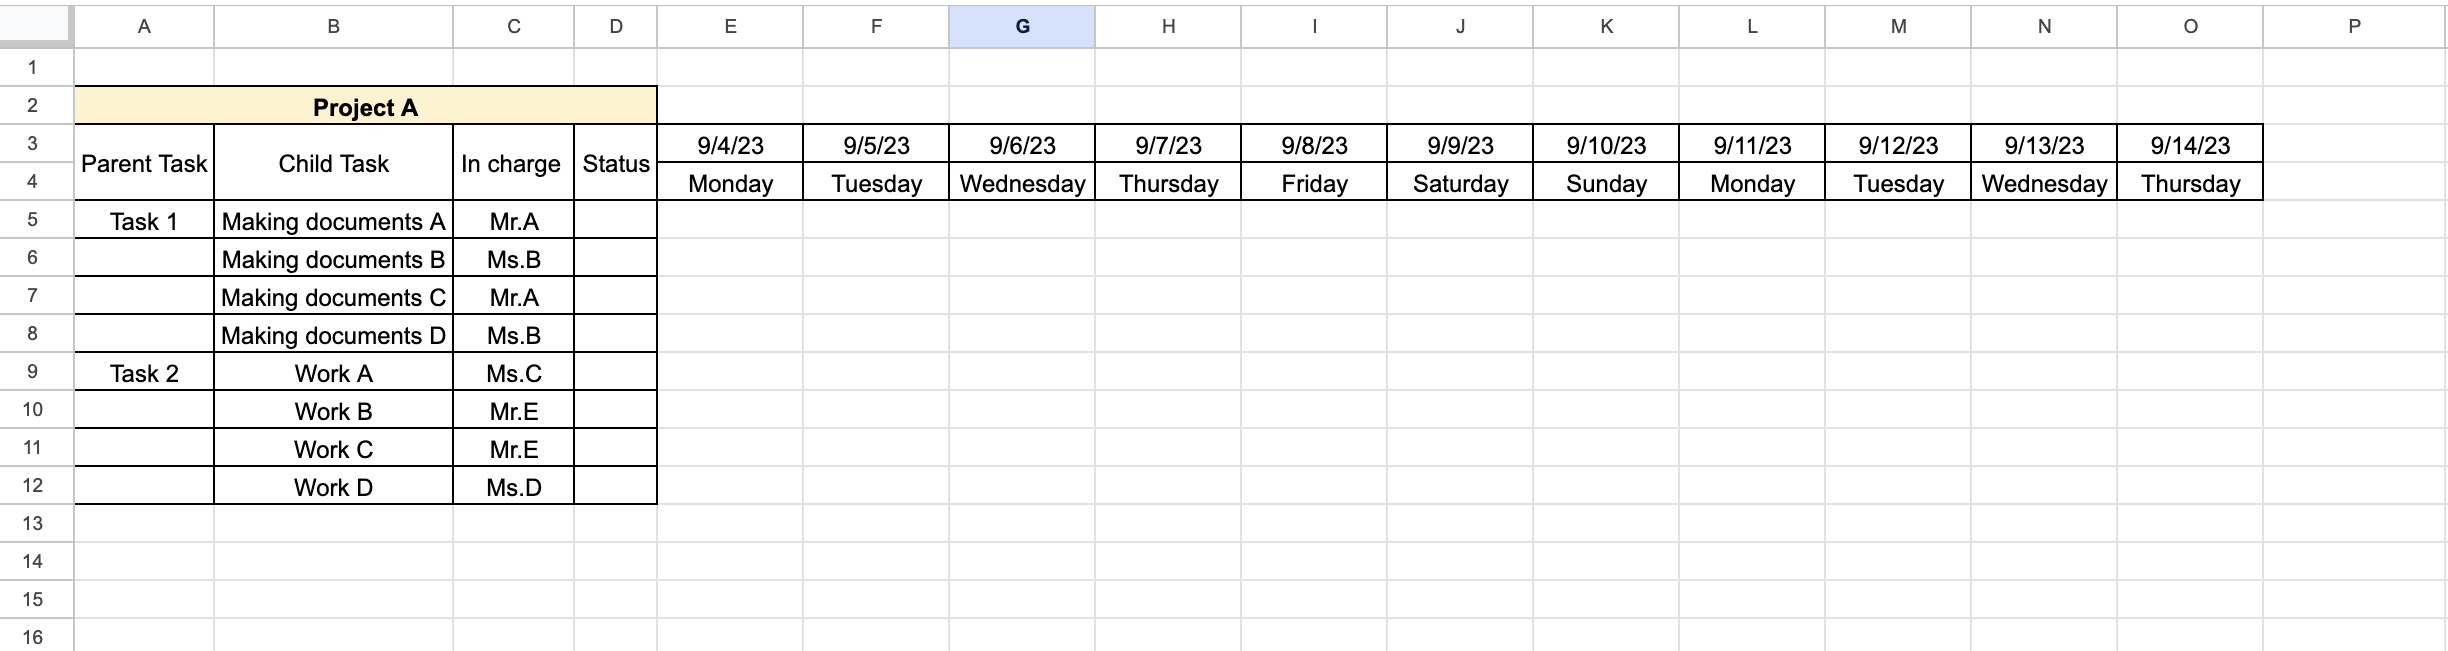
2. Enter the date of the project period
Next, enter the date of the project period, which is inefficient if done manually. So, as shown in the figure below, click on the “9/4/23” cell and pull the cross that appears in the lower right corner to the right to automatically enter the date and day of the week.
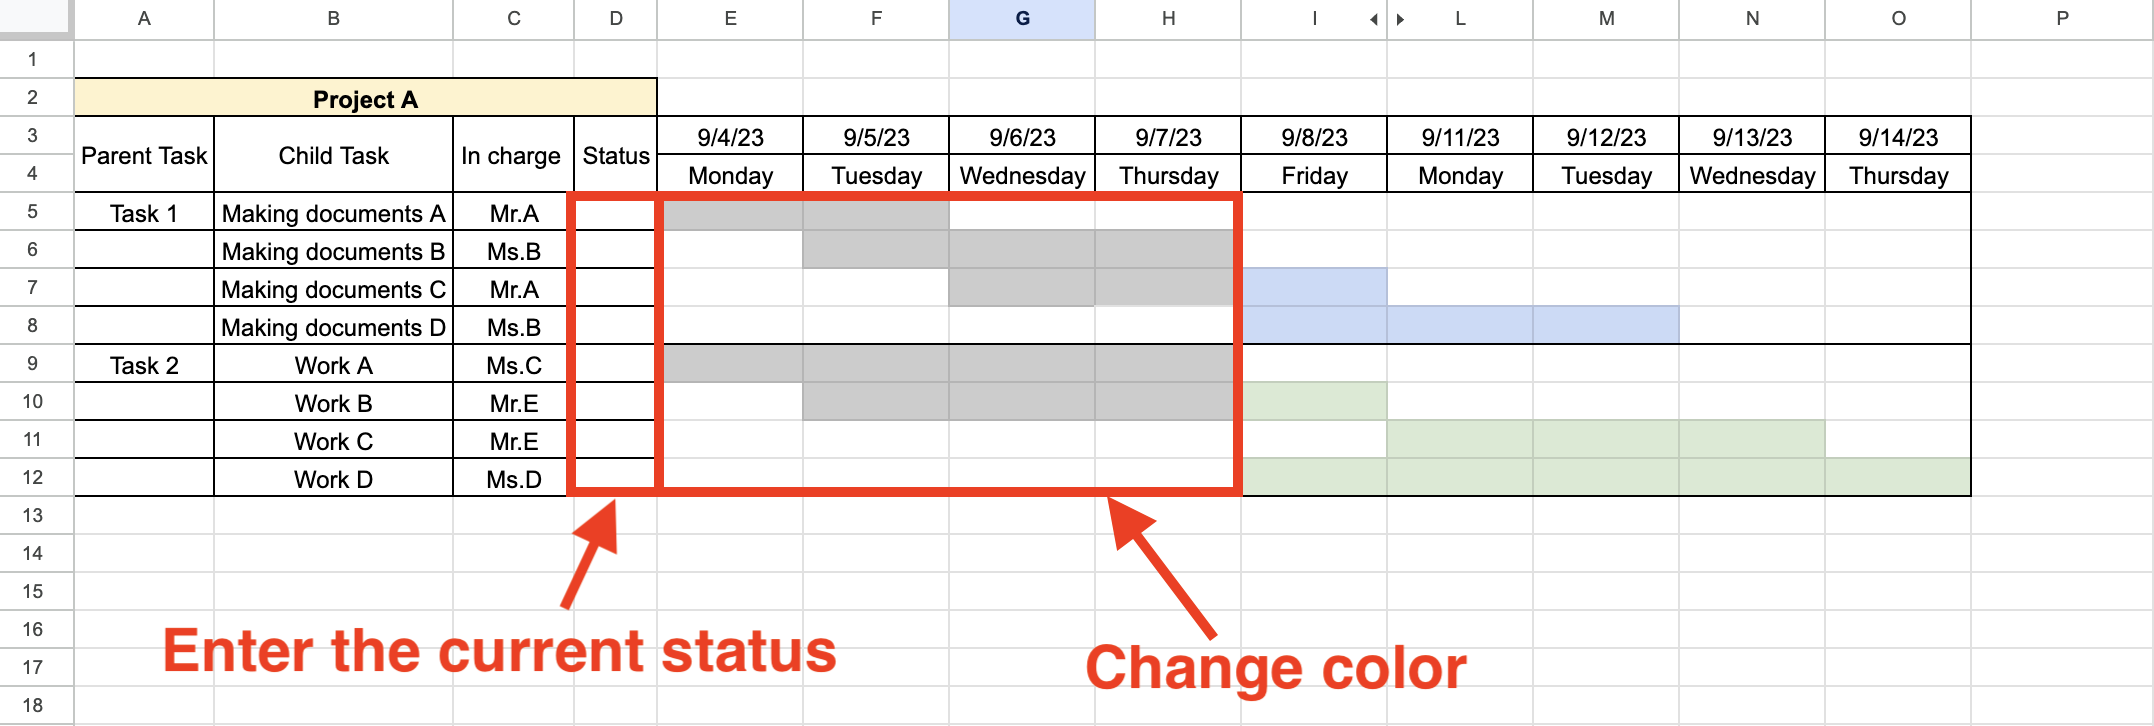
3. Drawing a gantt chart
Draw a gantt chart by filling in each task from its start date to its due date in any color. A Gantt chart is a chart to visualize the progress of work.
In the case of the chart below, you can instantly see that Task 1, “Making Documents A”, was started on 9/4/23 and should be completed by 9/5/23.
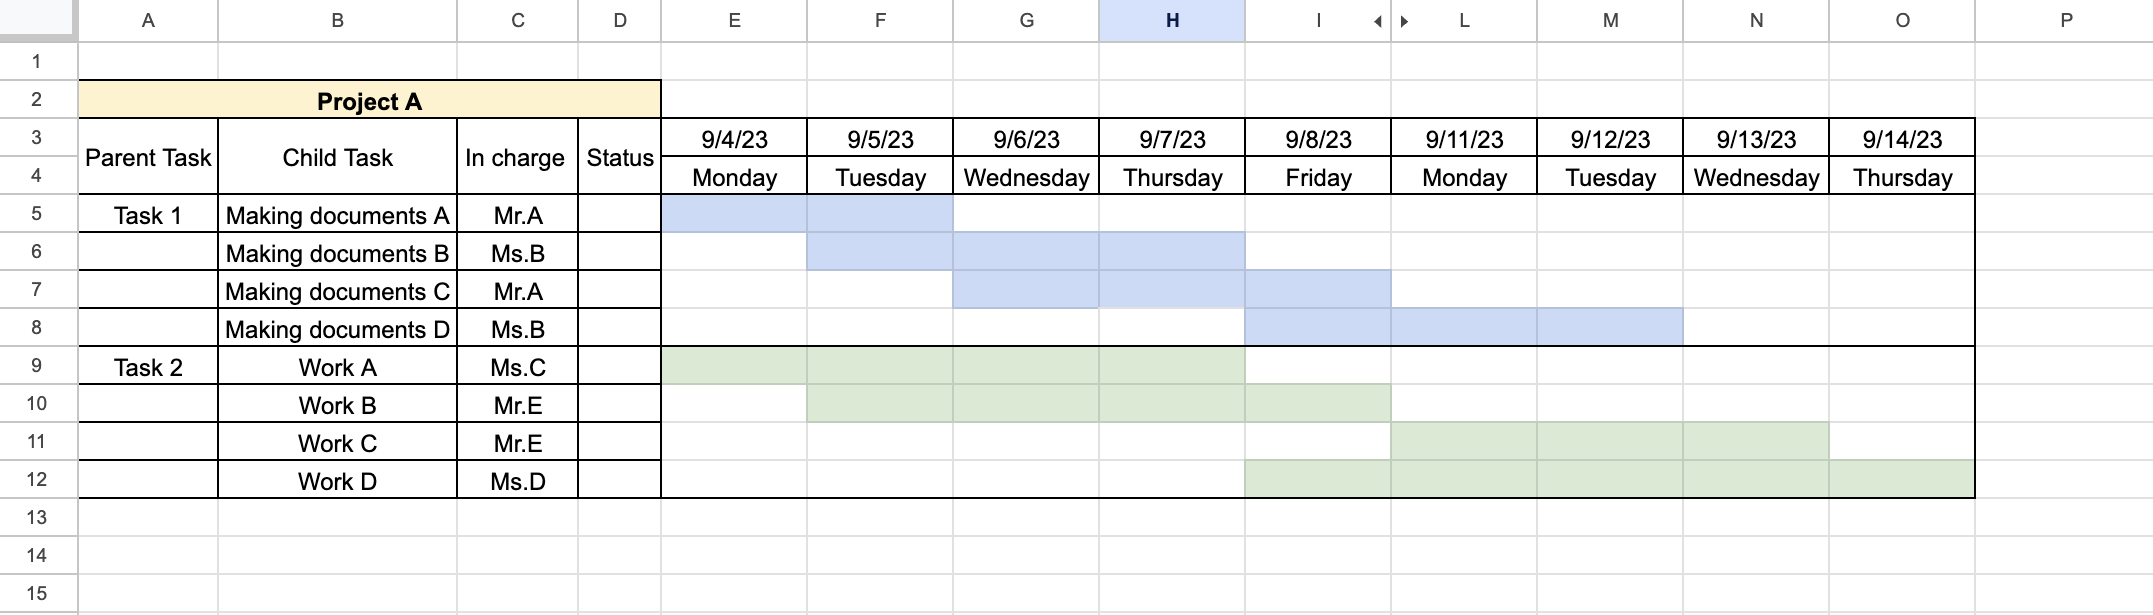
Then, if you set up rules such as “Fill in completed tasks in a different color” or “Enter ‘completed’ in the progress column,” the status of the task will also become easier to understand.
By following the above steps, anyone can create an easy-to-read Google Sheets progress chart.
3 effective ways to use an Google Sheets progress chart
Here we introduce three effective ways to use an Google Sheets progress chart. By practicing the following, you can prevent input errors and reduce the man-hours required for inputting information into the progress chart.
(1) Protect cells
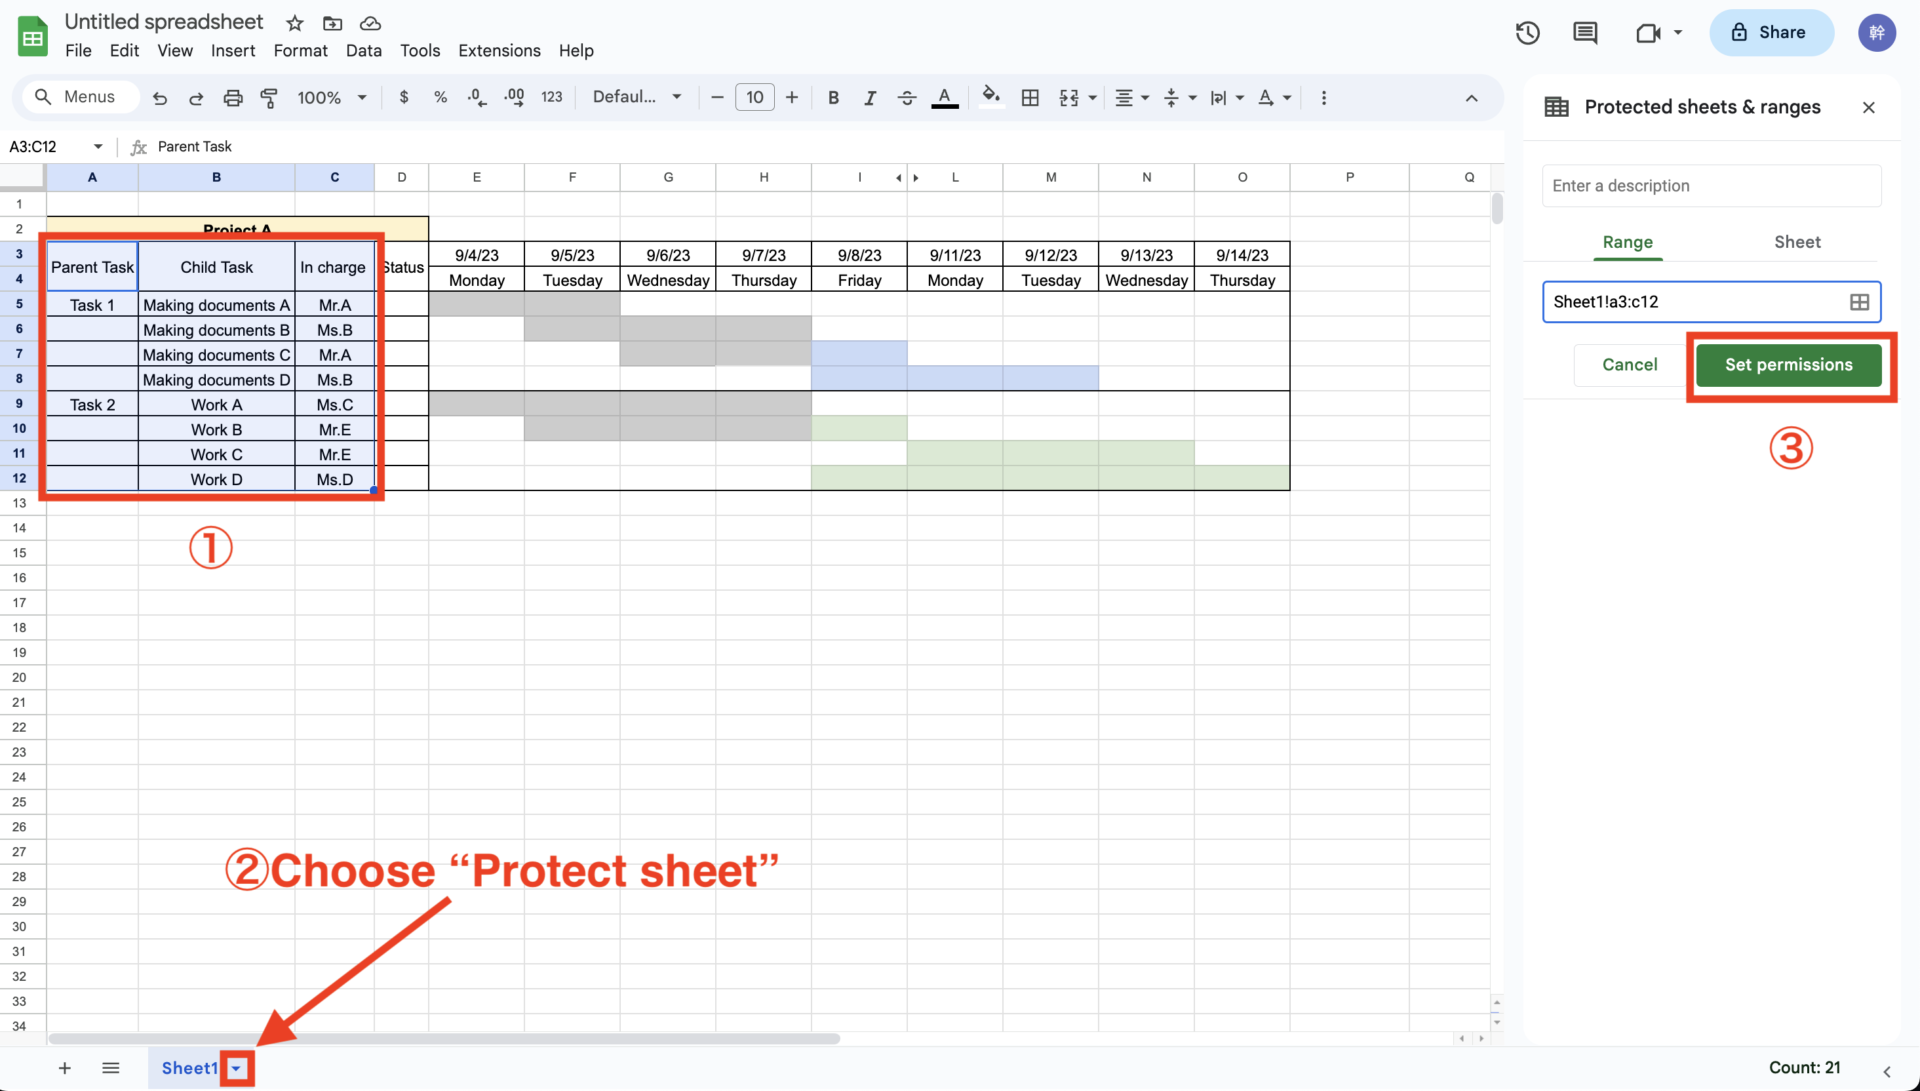
First of all, it is important to protect cells in order to separate “editable and non-editable” areas. Therefore, set the editable range by using “Protect Cells” as shown in the figure below.
The procedure is to select a range that anyone can edit, and then click on pull down of sheet name > [Protect Sheet] > [Set permissions].
Then, you can set the permission in detail as below, for example, if you invite specific member to access the sheets, the member who is invited can edit the cell that is designated only.
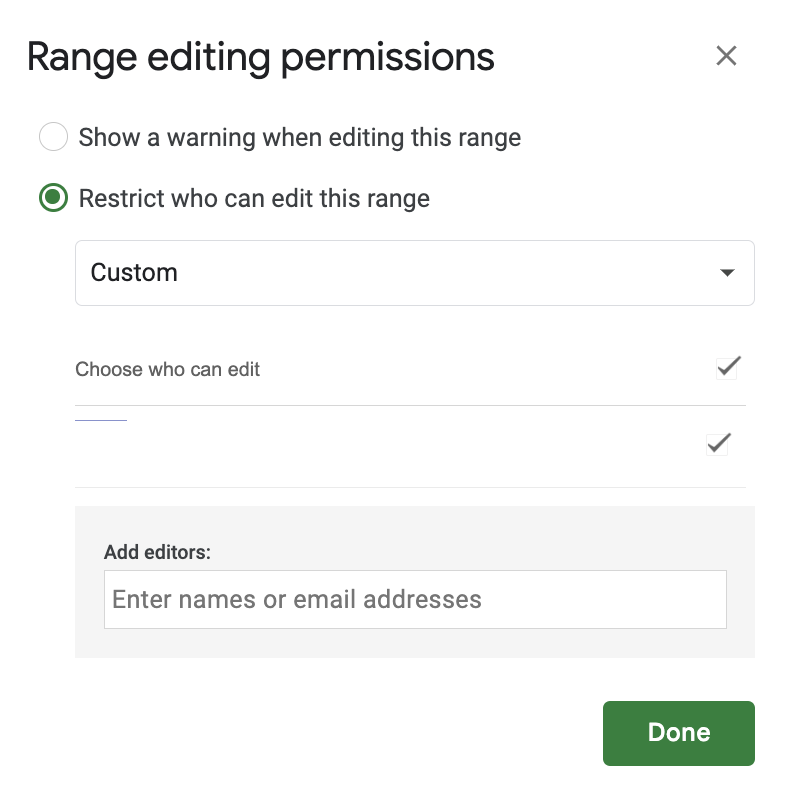
By restricting the edit range as described above, you can reduce the risk of members accidentally editing important parts of the document.
(2) Utilize functions
Next, the NETWORKDAYS.INTL function is used to visualize the time spent on each task.
In the NETWORKDAYS.INTL function, select the task start date, due date, and holiday pattern, and enter [=NETWORKDAYS.INTL(start date, due date, holiday pattern)] in the appropriate cell. In the example below, the holiday pattern is set to the first Saturday and Sunday off(This pattern is “1”).
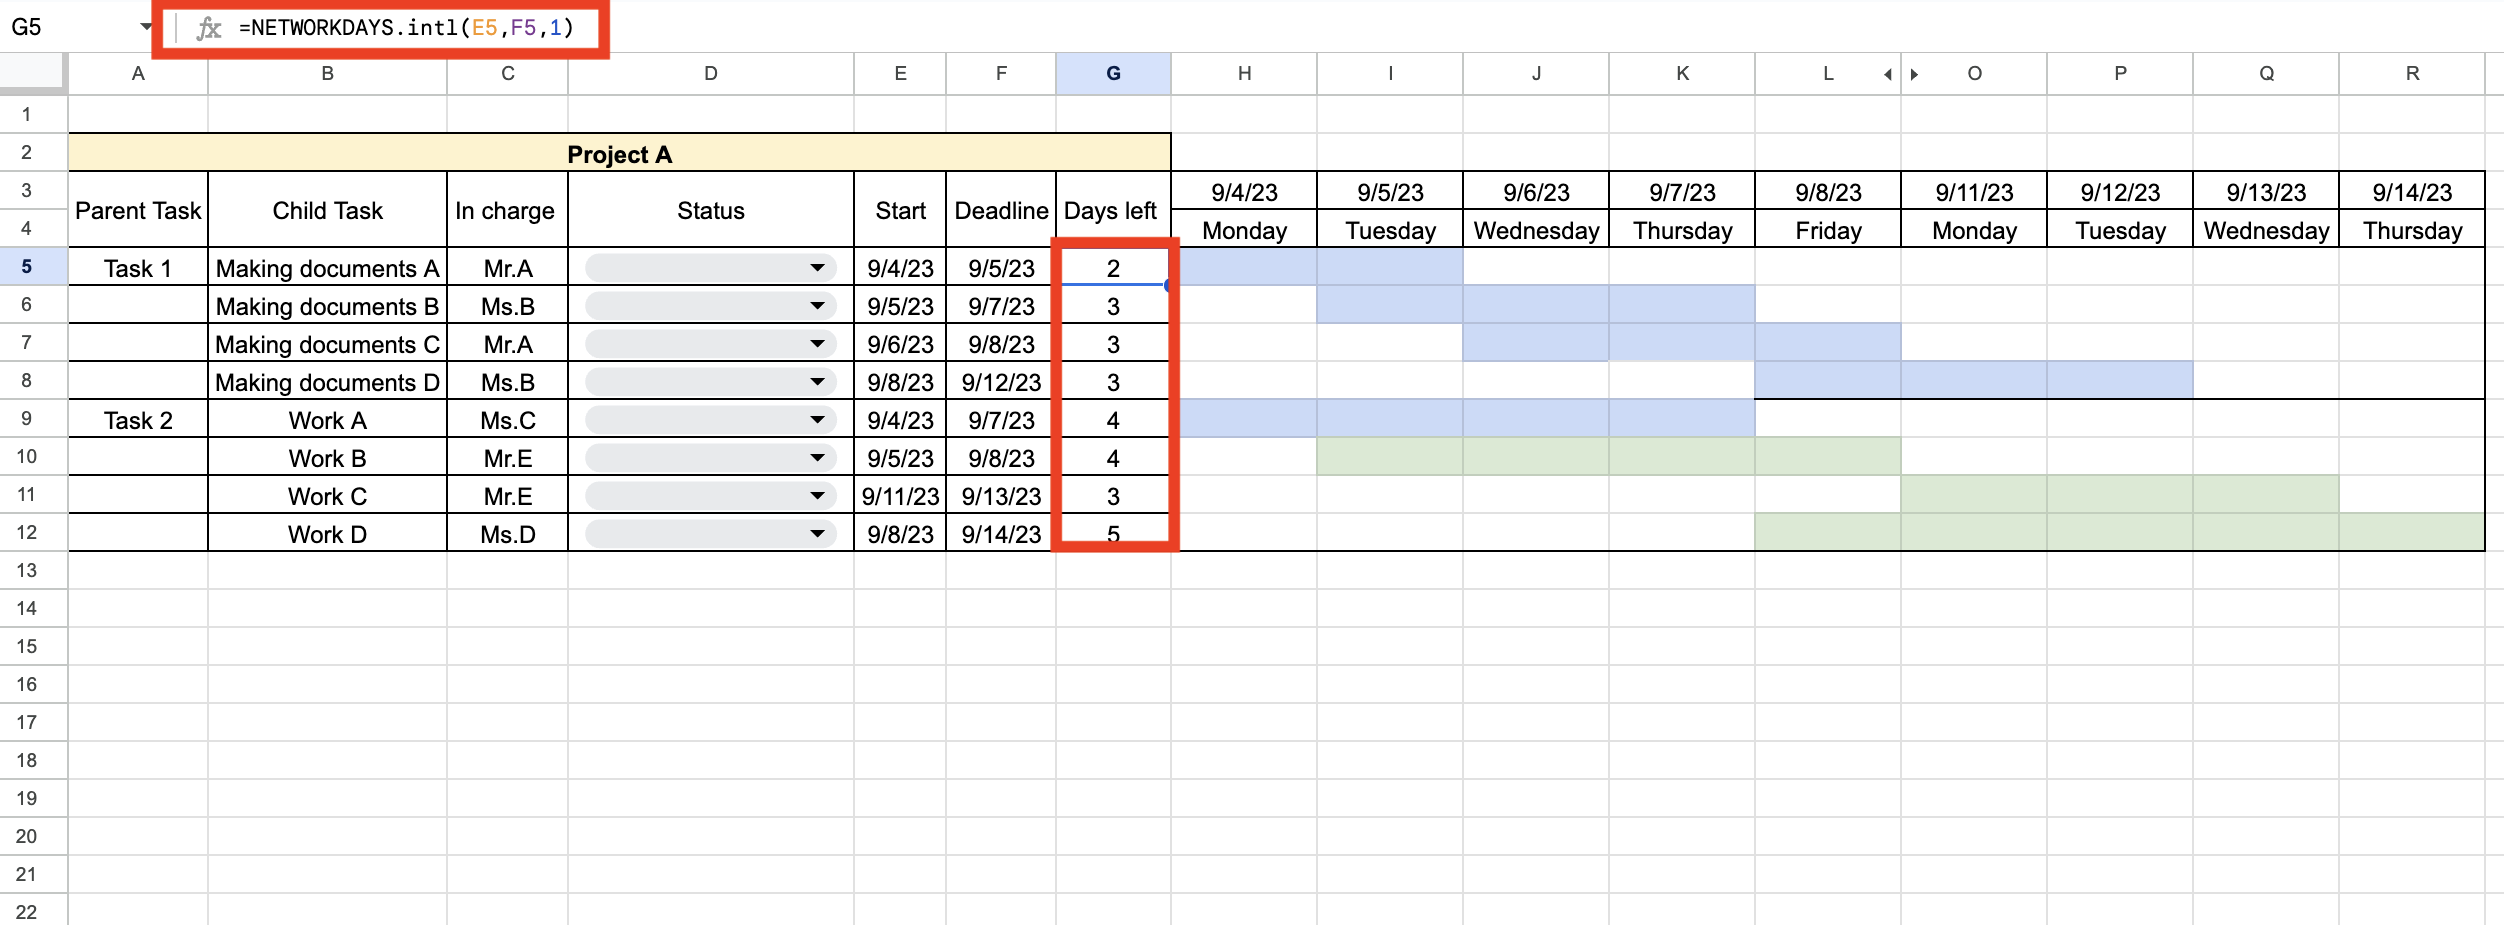
It is recommended to use the function as shown above to accurately display the work hours.
(3) Using pull-down settings
If you have predefined input items, use pull-down settings to reduce the time required for text input.
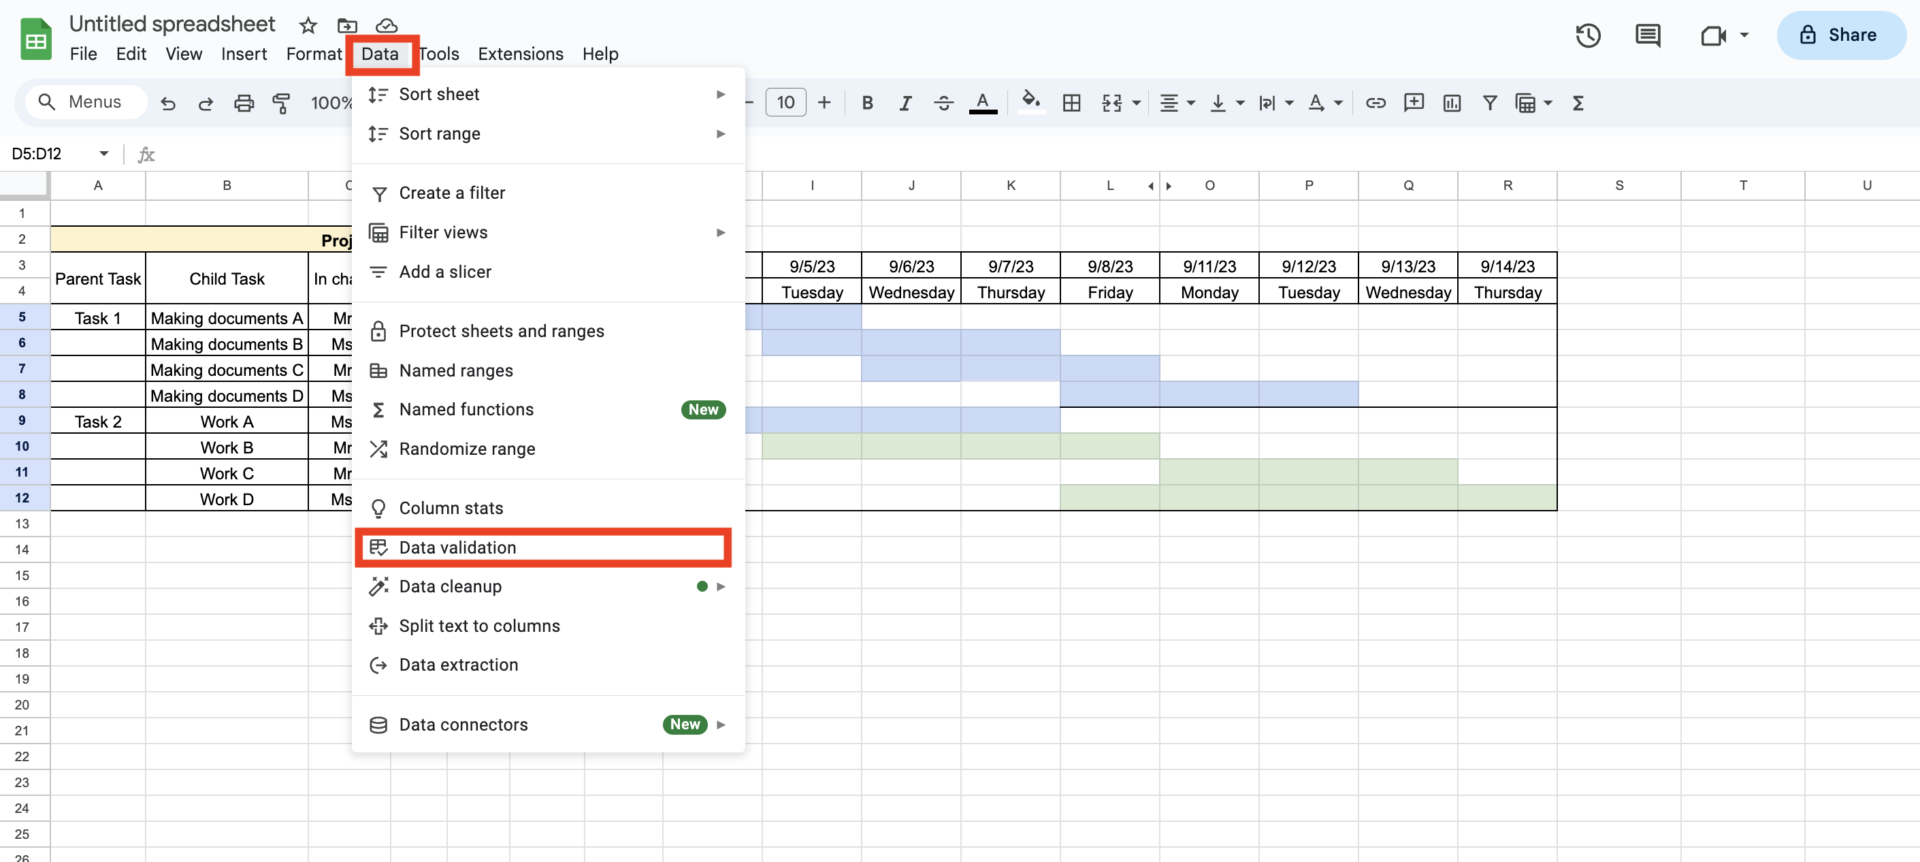
To use pull-down settings, select the appropriate cell and click [Data] > [Data validation].
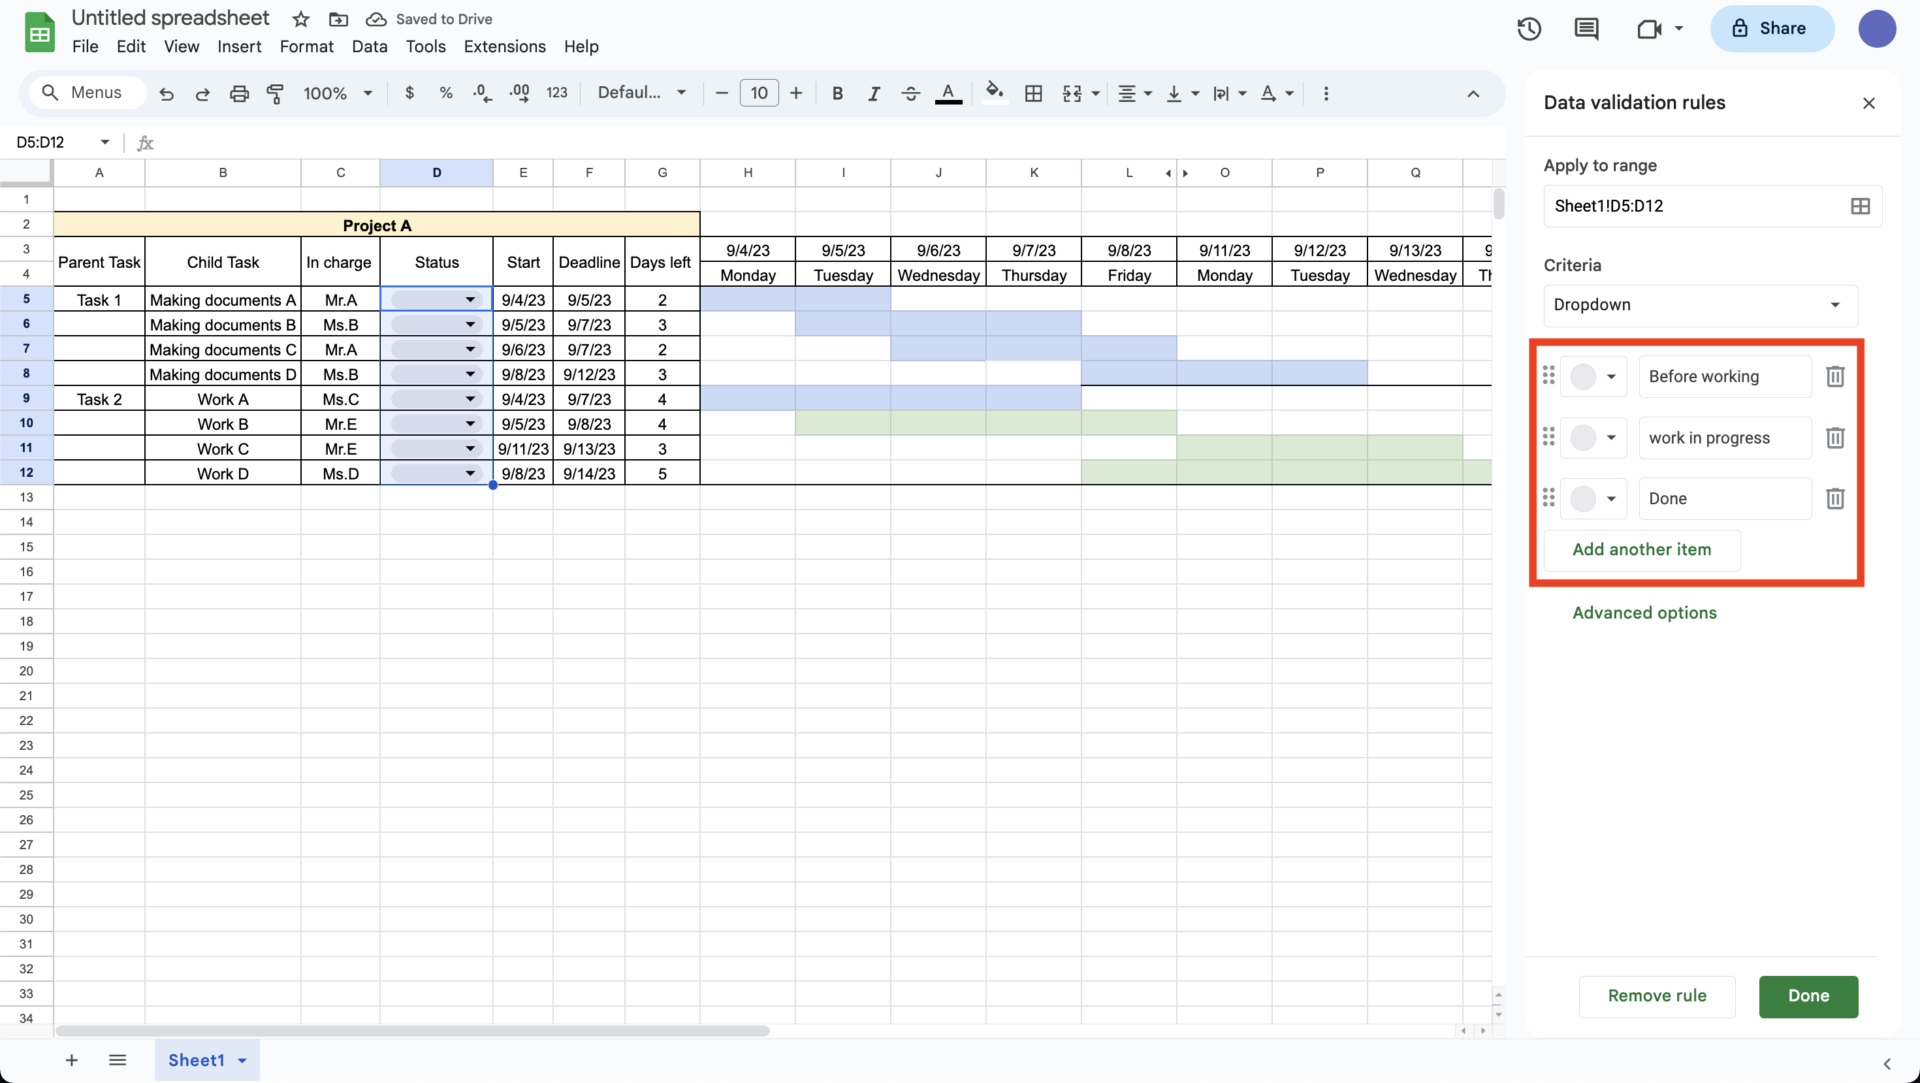
Next, set the items that are [Done, Work in progress, Before working] in above image, and click [Done] to complete the setting.
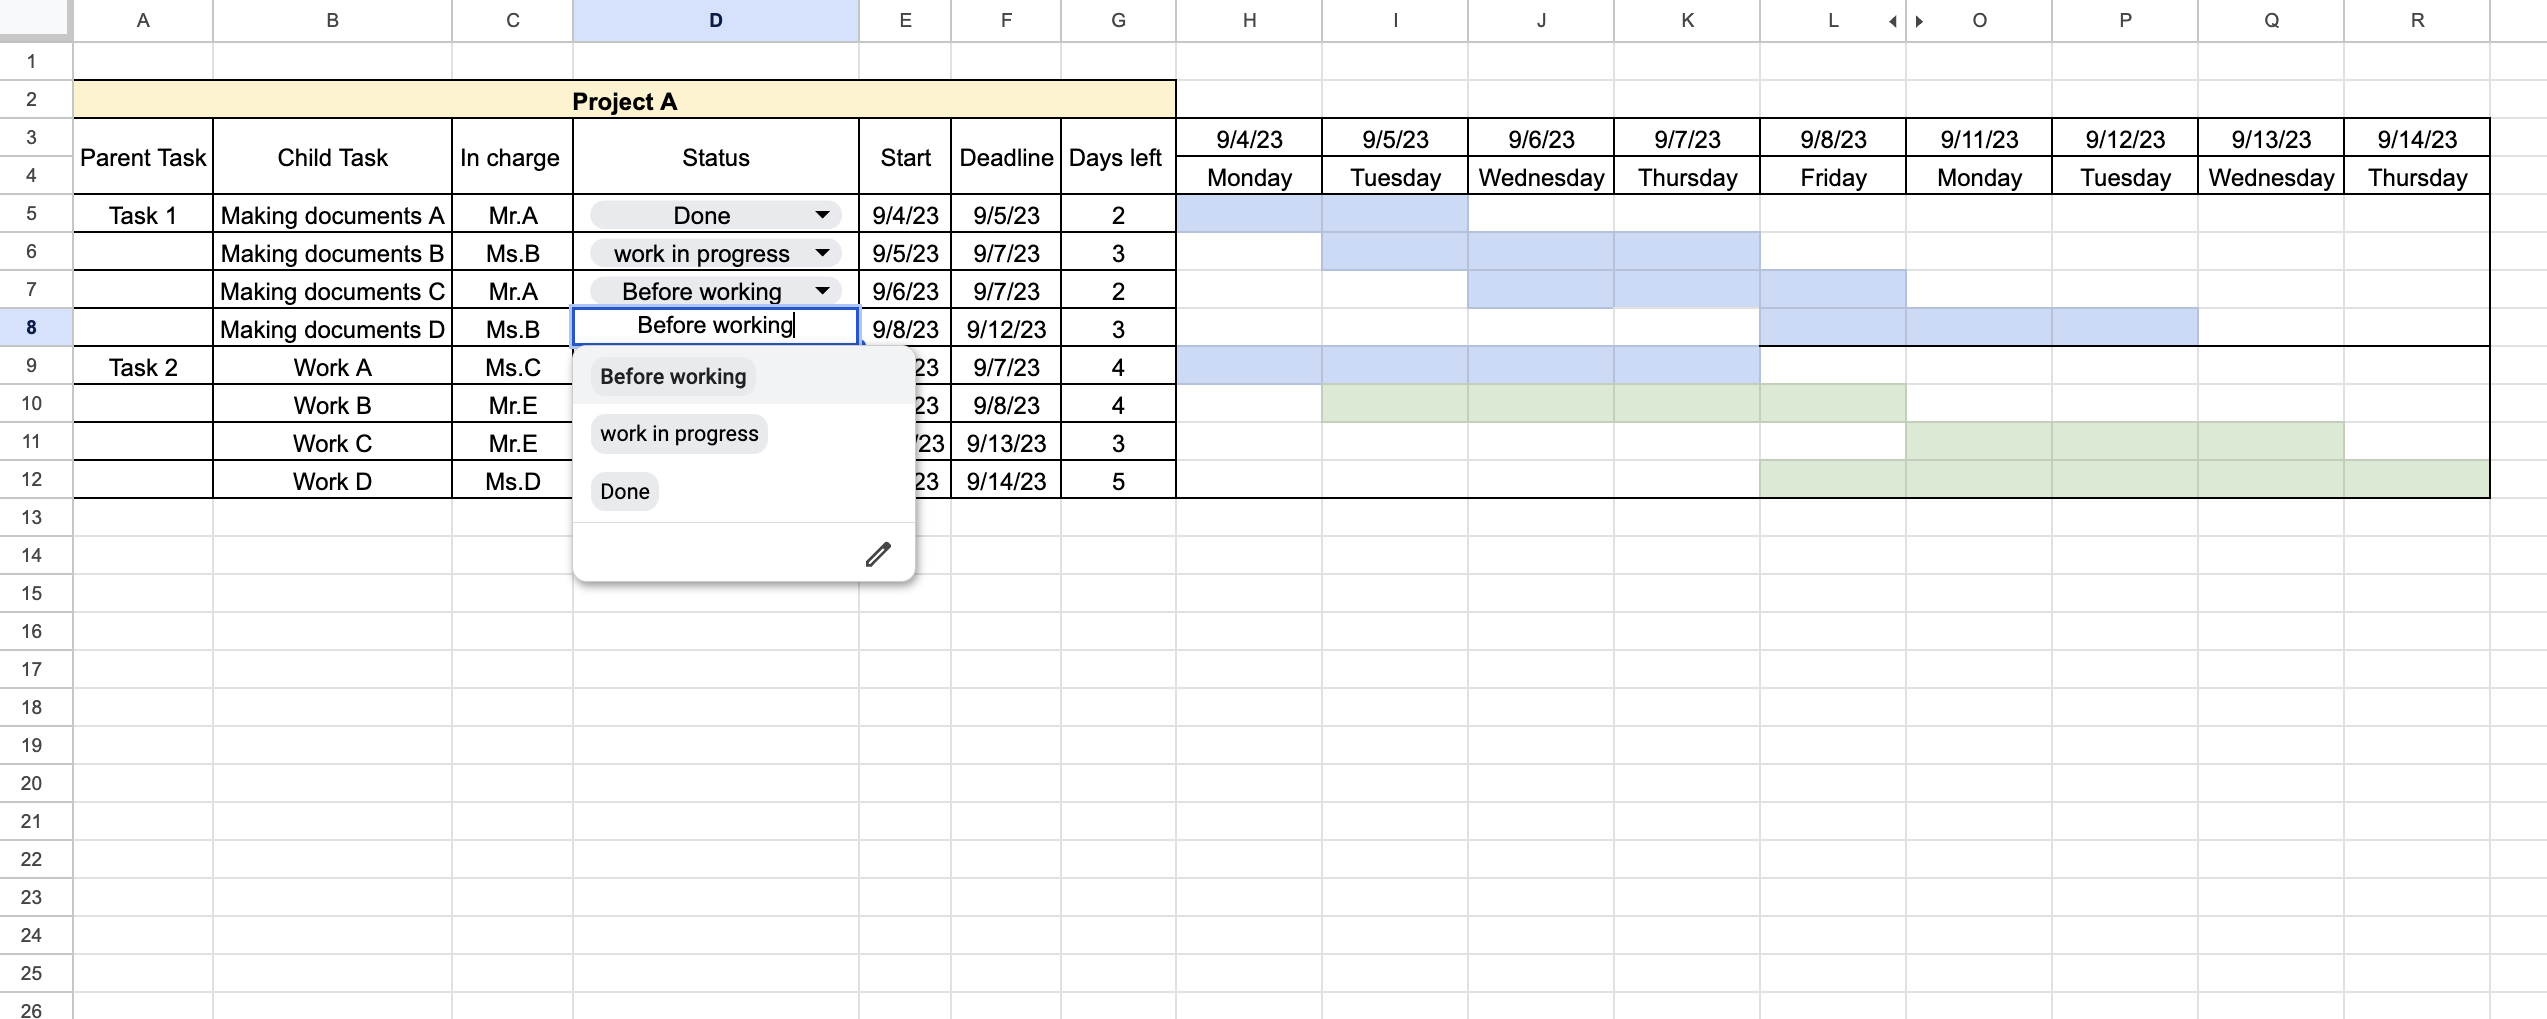
Once the settings are complete, you can select the item you entered in [Data validation rule] with a single click, as shown below, saving you the trouble of typing it over and over again.
(4) Use of templates
Finally, the use of templates is another effective way to operate a progress chart.
In general, many Google Sheets progress charts have special templates that can be downloaded free of charge from other site. By using a template, it is not necessary to create a structure from scratch, and it is easier to prevent omissions in the content.
Therefore, to reduce man-hours and errors in creating progress charts, consider using Google Sheets templates.
Best tool for making and managing progress chart Easier than Google Sheets
Below are tool that allow you to manage progress of project more easily than Google Sheets.
Progress management with Google Sheets is required the difficult processes that need to manage url of many sheets, set permission, and occur delay caused by plenty of data.
In the first place, Google Sheets is burdensome for managers because they have to add rows, columns, and sheets every time the number of tasks increases. Therefore, if there is an “information sharing tool” that allows information to be left in a notebook, it is possible to get rid of complicated file management and solve the need for e-mail.
However, multifunctional information sharing tools should be avoided because people who are not good at IT will not be able to use them. So, the best choice for team progress management is an information sharing tool Stock that even those from a non-IT company can easily use.
“Note” of Stock allow you to stock all kinds of information, and “Task” linked to the Note allow you to check the progress of team without getting mixed up on the topic. Stock also has a “Message” feature that solves the need to call or email each time to ask about progress.
Stock|A tool that even those with no IT skills can use without explanation

The simplest tool to stock information "Stock"
https://www.stock-app.info/en/
Stock is the simplest tool to stock information. Stock solves the problem, "there is no easy way to stock information within the company".
With Stock, anyone can easily store all kinds of information, including text information such as requirements, images, and files, using the Note feature.
In addition, by using the "Task" and "Message" functions, you can communicate with each topic described in the Note, so that information is not dispersed here and there and work can always be carried out in an organized manner.
<Why do we recommend Stock?>
- A tool for companies that are not familiar with ITYou don't need to have any IT expertise to get started.
- Simple and usable by anyoneStock is so simple that anyone can use it without any unnecessary features.
- Amazingly easy information storing and task managementIt is amazingly easy to store information such as shared information within a company, and intuitive task management is also possible.
<Stock's pricing>

- Free plan :Free
- Business plan :$5 / User / Month
- Enterprise plan :$10 / User / Month
3 demerits of progress management with Google Sheets
Here are 3 demerits of using Google Sheets for progress management.
(1) Difficult to view on smartphones and tablets
The first demerit is that it is difficult to view on a smartphone or tablet.
For example, when viewing an Google Sheets progress chart on a smartphone, it takes a lot of scrolling. In addition, because the screen is small, problems such as “inputting incorrect data” or “deleting important information” are not uncommon.
Thus, Google Sheets has demerits that make it difficult to view and operate on smartphones and tablets.
(2) Time-consuming to update information
The second demerit of using Google Sheets is that it takes time to update information.
Although Google Sheets is managed in a url format, the file must be opened and edited each time it is updated. In addition, it is difficult to see at a glance “who updated what and where”.
As a result, “no one updates the progress chart and before you know it, it is no longer in use”.
(3) Information sharing is not smooth
The third demerit is the lack of smooth information sharing.
Since Google Sheets has function that leaves comment, but it does not have an information sharing function, files must be shared by attaching them to e-mails. However, with e-mail, it is tedious and time-consuming to set up Cc and Bcc and to create greeting messages.
On the other hand, an “information sharing tool” that allows communication in the form of a notebook solves the need for e-mail, making it more suitable for progress management than Google Sheets. In particular, if Stock allows “Message” to be tied to “Note”, there is no need to get mixed up on the topic.
Summary of How to create a progress chart in Google Sheets
We have focused on how to create a progress chart in Google Sheets and what to keep in mind.
Google Sheets is a low hurdle to use, and you can create a progress chart using functions and pull-down settings. However, it also requires time and effort to “share the file by e-mail” and “make sure it has not been accidentally edited or deleted”.
On the other hand, an information sharing tool that allows users to exchange information in a notebook can manage progress more smoothly than Google Sheets. However, a multifunctional information sharing tool may not be usable by all employees, so the decision must be made based on whether the tool can be used by everyone without learning costs.
In conclusion, the best choice for team progress management is “Stock,” which even those who is not familiar with IT can use without explanation.
Free registration takes only 1 minute, so using Stock, an information sharing tool, to streamline your progress management.
